Percentage GridPercentage Grid Indicator
Description:
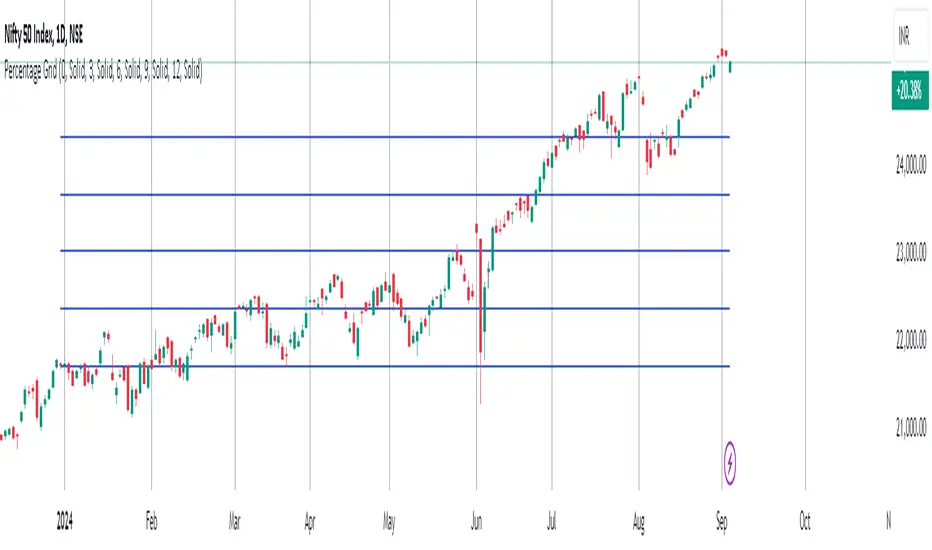
The Percentage Grid indicator is designed to assist traders in identifying significant support and resistance levels based on yearly percentage changes. This indicator plots horizontal lines on the chart from the start of the year, allowing you to customize how much percentage each line represents. Currently, you can set up to 5 horizontal lines, each representing a different percentage change from the beginning of the year.
For instance, when applied to the SBI Bank stock, you can customize the lines to display various percentage changes from the start of the year, such as 20%, 25%, and up to 35%, as the SBIN stock is currently trading around these levels. This visualization helps traders to easily identify key levels where price action tends to react, providing valuable insights for making trading decisions.
Principles of Trading Technical Analysis:
The Percentage Grid indicator is grounded in the principle of support and resistance levels, which are fundamental concepts in technical analysis. These levels are specific price points on a chart that tend to act as barriers, preventing the price from getting pushed in a certain direction. The indicator helps in:
Identifying Support Levels: Price levels where a downtrend can be expected to pause due to a concentration of buying interest.
Identifying Resistance Levels: Price levels where an uptrend can be expected to pause due to a concentration of selling interest.
By customizing and plotting percentage-based horizontal lines, the indicator highlights these critical levels based on the percentage change from the start of the year.
How to Use:
Add the Indicator to Your Chart:
Search for "Percentage Grid" in the TradingView indicator library and add it to your chart.
Customize Percentage Levels:
Access the indicator settings to customize the percentage change each line represents.
You can set up to 5 different percentage levels. For example, you can set lines at 20%, 25%, 30%, 35%, and 40%.
Interpret the Grid Lines:
The plotted lines will represent the specified percentage changes from the start of the year.
Use these lines to identify potential support and resistance levels where price action is likely to react.
Practical Application:
Look for price bounces or reversals around these levels, which can indicate strong support or resistance.
Combine the Percentage Grid with other technical analysis tools, such as moving averages or trend lines, to confirm potential trading opportunities.
Example:
In the accompanying screenshot, the Percentage Grid is applied to the SBI Bank stock. The lines are set to display 20%, 25%, 30%, 35%, and 40% changes from the start of the year. Notice how the price action respects these levels, providing clear areas where support and resistance are evident.
By incorporating the Percentage Grid into your trading strategy, you can enhance your ability to identify key price levels and make more informed trading decisions.
Happy Trading!
在腳本中搜尋"key levels"
Daily Monday Weekly Monthly Quarterly Yearly High Low Mid This indicator can be useful for traders who are interested in analyzing price movements over different time periods. By displaying the daily, Monday, weekly, monthly, quarterly, and yearly high and low values along with their mid values on a chart, traders can get a better understanding of how prices have behaved over longer periods of time.
For example, a trader might use this information to identify trends or patterns in the market. They might look for occasions when the daily high and low values move outside of an established range or when the weekly or monthly mid values cross certain key levels. This could signal a potential change in the market trend that the trader could act upon.
Additionally, the code can help traders identify key support and resistance levels based on the high and low values of the candles. By plotting these values on a chart, traders can see where prices tend to find support or resistance over different time periods. This information can be used to place stop loss orders or take profit orders at important levels.
Overall, the benefit of using the code you provided is that it offers traders a comprehensive view of price movements over different time periods, which can aid in making more informed trading decisions.
Each level described above has its own unique label, which is abbreviated for convenience. These abbreviations are listed below for quick reference:
For daily levels: DH (Daily High), DM (Daily Mid), and DL (Daily Low)
For Monday levels: MonH (Monday High), MonM (Monday Mid), and MonL (Monday Low)
For monthly levels: MH (Monthly High), MU50 (Monthly 50 percent of Mid and High), MM (Monthly Mid), MD50 (Monthly 50 percent of Mid and Low), and ML (Monthly Low)
For quarterly levels: 3MH (Quarterly High), 3MU50 (Quarterly 50 percent of Mid and High), 3MM (Quarterly Mid), 3MD50 (Quarterly 50 percent of Mid and Low), and 3ML (Quarterly Low)
For yearly levels: YH (Yearly High), YU50 (Yearly 50 percent of Mid and High), YM (Yearly Mid), YD50 (Yearly 50 percent of Mid and Low), and YL (Yearly Low)
These labels can help you quickly identify the different levels and keep track of important price points.
If the chosen timeframe does not fall under the category of intraday, daily and Monday level will not be displayed.
Please feel free to send your suggestions to @z_mehran.

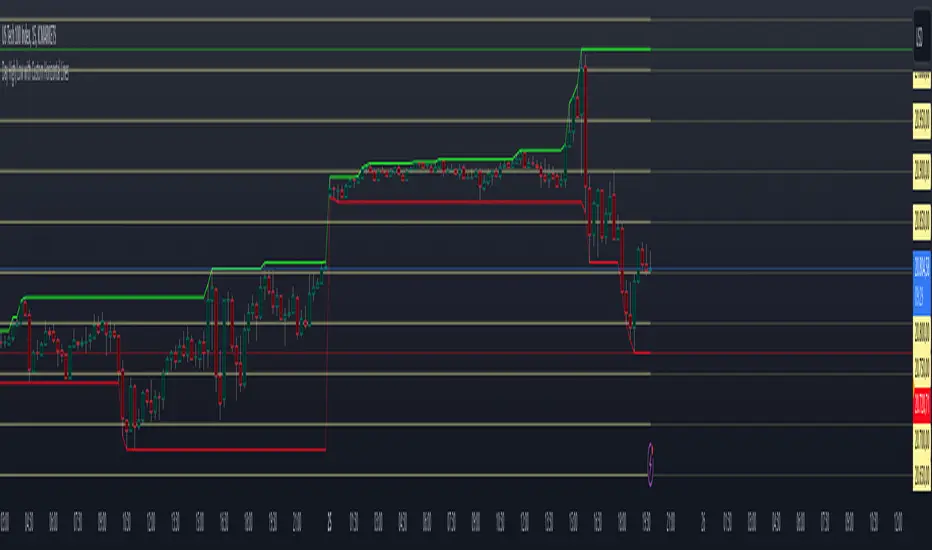
Intermarket Swing Projection [LuxAlgo]The Intermarket Swing Projection allows traders to plot price movement swings from any user-selected asset directly onto the chart in the form of zigzags and/or horizontal support and resistance levels.
This tool rescale the external asset price on the user chart, enabling traders to make direct comparisons.
It answers the question of how different the price behavior is between two assets, accounting for each asset's volatility.
🔶 USAGE
This tool is based on swing detection of two different assets: the chart and a user-selected asset. It allows traders to compare two assets on an equal footing while accounting for volatility and price behavior.
Traders can customize the detection by selecting a custom ticker, timeframe, the number of swings and length for swing detection. This makes the tool a Swiss army knife for asset comparison.
As we can see in the image below, the Show Last, Pivot Length, and Spread parameters are key to defining the final output of the tool.
"Show Last" defines how many pivots are displayed. "Pivot Length" is used for pivot detection; a larger value will detect larger market structures. "Spread" defines how far apart the horizontal levels will be from their original location in terms of volatility.
🔹 Comparing different assets
This image shows the Nasdaq 100 futures contract compared to four other futures contracts: S&P 500, gold, bitcoin, and euro/U.S. dollar.
Plotting all of these assets in Nasdaq 100 terms makes it easy to compare and analyze price behaviors and identify key levels.
In the top left chart, we have NQ vs. ES. It's no surprise that they are practically an exact match; a large portion of the S&P 500 is technology.
In the top right chart, NQ vs. GC, we see totally different behaviors. We can clearly see the summer consolidation in gold and the resumption of the uptrend, which took gold above 29,200 NQ points, up from 21,200.
In the bottom right chart, we see bitcoin making new highs, way above the Nasdaq in May, July, and October. However, the last high was way below the Nasdaq prices on October 27—the first lower high in a while. Sellers are pushing down.
Finally, the bottom left chart is NQ vs. 6E. We can see large volatility in the uptrend since February, with NQ unable to catch up until now. The last swing low was almost a match, and 6E is in a range.
As we can see, this tool allows us to perform intermarket analysis properly by accounting for each asset's volatility and price behavior. Then, we plot them on the same scale on equal terms, which makes performing this kind of analysis easy.
As we can see in the chart above, the assets are the same as in the previous image, but the timeframe is 1H with different settings.
Note the horizontal levels acting as support and resistance, as well as how NQ prices react to the zones marked with white circles. These levels are derived from custom assets selected by the user.
🔹 Displaying Elements
Zig-zag allows traders to clearly see the path that the selected asset's price took, as well as its turning points.
Horizontal levels are displayed from those turning points to the present and can be used as support or resistance. Traders can adjust the spread parameter in the settings panel to expand or contract those levels' volatility.
There are two color modes for the levels: average and pivots. In the first mode, green is used for levels below the average and red for levels above the average. The second uses green for swing lows and red for swing highs.
The backpaint feature is enabled by default and allows the swings to be displayed in the correct location. With this feature disabled, the swings will be displayed in the current location when a new swing is detected.
🔶 DETAILS
On a more technical note, the rescaling is formed by calculating three main elements from all the swings detected on the custom and chart assets:
The chart asset's average of all swing points
The chart asset's standard deviation of all swing points
The custom asset's z-score for each swing point
Then, the re-scaled swing point is calculated as the average plus the z-score multiplied by the standard deviation. This makes it possible to plot AAPL swings on an NQ chart, for example.
Thanks to re-scaling, we can directly compare the price behavior of two assets with different price ranges and volatility on the same chart.
🔶 SETTINGS
🔹 Trendlines
Ticker: Select the custom ticker.
Timeframe: Select a custom timeframe.
Show Last: Select how many swing points to display.
Pivot Length: Select the size for swing point detection.
Spread: Volatility multiplier for horizontal levels. Larger values mean the levels are farther apart.
Backpaint: Enable or disable the backpaint feature. When enabled, the drawings will be displayed where they were detected. When disabled, the drawings will be displayed at the moment of detection.
🔹 Style
Show ZigZag: Enable or disable the ZigZag display and choose a line style.
Show Levels: Enable or disable the levels display and choose a line style.
Color Mode: Choose between Average Mode, which colors all levels below the average bullish and all levels above bearish, and Pivot Mode, which colors swing highs bearish and swing lows bullish.
Bullish: Select a bullish color.
Bearish: Select a bearish color.
ZigZag: Select the ZigZag color.

Support Resistance with Order BlocksIndicator Description
Professional Price Level Detection for Smart Trading. Master the Markets with Precision Support/Resistance and Order Block Analysis . It provides traders with clear visual cues for potential reversal and breakout areas, combining both retail and institutional trading concepts into one powerful tool.
The Support & Resistance with Order Blocks indicator is a versatile Pine Script tool designed to empower traders with clear, actionable insights into key market levels. By combining advanced pivot-based support and resistance (S/R) detection with order block (OB) filtering, this indicator delivers clean, high-probability zones for entries, exits, and reversals. With customizable display options (boxes or lines) and intuitive settings, it’s perfect for traders of all styles—whether you’re scalping, swing trading, or investing long-term. Overlay it on your TradingView chart and elevate your trading strategy today!
________________________________________
Key Features
✅ Dynamic Support/Resistance - Auto-adjusting levels based on price action
✅ Smart Order Block Detection - Identifies institutional buying/selling zones
✅ Dual Display Modes - Choose between Boxes or Clean Lines for different chart styles
✅ Customizable Sensitivity - Adjust detection parameters for different markets
✅ Broken Level Markers - Clearly shows when key levels are breached
✅ Timeframe-Adaptive - Automatically adjusts for daily/weekly charts
1. Dynamic Support & Resistance Detection
Identifies critical S/R zones using pivot high/low calculations with adjustable look back periods.
Visualizes active S/R zones with distinct colors and labels ("Support" or "Resistance" for boxes, lines for cleaner charts).
Marks broken S/R levels as "Br S" (broken support) or "Br R" (broken resistance) when historical display is enabled, aiding in breakout and reversal analysis.
2. Smart Order Block Identification
Detects bullish and bearish order blocks based on significant price movements (default: ±0.3% over 5 candles).
Highlights institutional buying/selling zones with customizable colors, displayed as boxes or lines.
Filters out overlapping OB zones to keep your chart clutter-free.
3. Dual Display Options
Boxes or Lines: Choose to display S/R and OB as boxes for detailed zones or lines for a minimalist view.
Line Width Customization: Adjust line widths for S/R and OB (1–5 pixels) for optimal visibility.
Color Customization: Tailor colors for active/broken S/R and bullish/bearish OB zones.
4. Advanced Overlap Filtering
Ensures S/R zones don’t overlap with OB zones or other S/R levels, providing only the most relevant levels.
Limits the number of active zones (default: 10) to maintain chart clarity.
5. Historical S/R Visualization
Optionally display broken S/R levels with distinct colors and labels ("Br S" or "Br R") to track historical price reactions.
Broken levels are dynamically updated and removed (or retained) based on user settings.
6. Timeframe Adaptability
Automatically adjusts pivot detection for daily/weekly timeframes (40-candle look back) versus shorter timeframes (20-candle look back).
Works seamlessly across all asset classes (stocks, forex, crypto, etc.) and timeframes.
________________________________________
How It Works
• Support & Resistance:
Uses ta.pivothigh and ta.pivotlow to detect significant price pivots, with a user-defined look back (default: 5 candles post-pivot).
Plots S/R as boxes (with labels "Support" or "Resistance") or lines, extending to the current bar for real-time relevance.
Broken S/R levels are marked with adjusted colors and labels ("S" or "R" for boxes, "Br S" or "Br R" for lines when historical display is enabled).
• Order Blocks:
Identifies OB based on strong price movements over 4 candles, plotted as boxes or lines at the candle’s midpoint.
Validates OB to prevent overlap, ensuring only significant zones are displayed.
Removes OB zones when price breaks through, keeping the chart focused on active levels.
• Customization:
Toggle S/R and OB visibility, adjust detection sensitivity, and set maximum active zones (4–50).
Fine-tune line widths and colors for a personalized chart experience.
________________________________________
Why Use This Indicator?
• Precision Trading: Pinpoint high-probability entry/exit zones with filtered S/R and OB levels.
• Clean Charts: Overlap filtering and zone limits reduce clutter, focusing on key levels.
• Versatile Display: Switch between boxes for detailed zones or lines for simplicity, with adjustable line widths.
• Institutional Edge: Leverage OB detection to align with institutional activity for smarter trades.
• User-Friendly: Intuitive settings and clear visuals make it accessible for beginners and pros alike.
________________________________________
Settings Overview________________________________________
⚙ Input Parameters
Settings Overview
Display Options:
Display Type: Choose "Boxes" or "Lines" for S/R and OB visualization.
S/R Line Width: Set line thickness for S/R lines (1–5 pixels, default: 2).
OB Line Width: Set line thickness for OB lines (1–5 pixels, default: 2).
Order Block Options:
Show Order Block: Enable/disable OB display.
Bull/Bear OB Colors: Customise border and fill colors for bullish and bearish OB zones.
Support/Resistance Options:
Show S/R: Toggle active S/R zones.
Show Historical S/R: Display broken S/R levels, marked as "Br S" or "Br R" for lines.
Detection Period: Set candle lookback for pivot detection (4–50, default: 5).
Max Active Zones: Limit active S/R and OB zones (4–50, default: 10).
Colors: Customise active and broken S/R colors for clear differentiation.
________________________________________
How to Use
1. Add to Chart: Apply the indicator to your TradingView chart.
2. Customize Settings:
o Select "Boxes" or "Lines" for your preferred display style.
o Adjust line widths, colors, and detection parameters to suit your trading style.
o Enable "Show Historical S/R" to track broken levels with "Br S" and "Br R" labels.
3. Analyze Levels:
o Use support zones (green) for buy entries and resistance zones (red) for sell entries.
o Monitor OB zones for institutional activity, signaling potential reversals or continuations.
o Watch for "Br S" or "Br R" labels to identify breakout opportunities.
4. Combine with Other Tools: Pair with trend indicators, volume analysis, or price action for a robust strategy.
5. Monitor Breakouts: Trade breakouts when price breaches S/R or OB zones, with historical labels providing context.
________________________________________
Example Use Cases
• Swing Trading: Use S/R and OB zones to identify entry/exit points, with historical broken levels for context.
• Breakout Trading: Trade price breaks through S/R or OB, using "Br S" and "Br R" labels to confirm reversals.
• Scalping: Adjust detection period for faster S/R and OB identification on lower timeframes.
________________________________________
• Performance: Optimized for all timeframes, with best results on 5M, 15M, 30M, 1H, 4H, or daily charts for swing trading.
• Compatibility: Works with any asset class and TradingView chart.
________________________________________
Get Started
Transform your trading with Support & Resistance with Order Blocks! Add it to your chart, customize it to your style, and trade with confidence. For questions or feedback, drop a comment on TradingView or message the author. Happy trading! 🚀
________________________________________
Disclaimer: This indicator is for educational and informational purposes only. Always conduct your own analysis and practice proper risk management before trading.

ORB Advanced Cloud Indicator & FIB's by TenAMTraderSummary: ORB Advanced Cloud Indicator with Alerts and Fibonacci Retracement Targets by TenAMTrader
This TradingView script is an advanced version of the Opening Range Breakout (ORB) indicator, enhanced with visual clouds and Fibonacci retracement/extension levels. It is designed to help traders identify key price levels and track price movements relative to those levels throughout the trading day. The script includes alert functionalities to notify traders when price crosses key levels and when Fibonacci levels are reached, which can serve as potential entry and exit targets.
Key Features:
Primary and Secondary Range Calculation:
The indicator calculates the primary range (defined by a start and end time) and optionally, a secondary range.
The primary range includes the highest and lowest prices during the designated time period, as well as the midpoint of this range.
The secondary range (if enabled) tracks another price range during a second time period, with its own high, low, and midpoint.
Visual Clouds:
The script draws colored clouds between the high, midpoint, and low of the opening range.
The upper cloud spans between the Opening High and Midpoint, while the lower cloud spans between the Midpoint and Opening Low.
Similarly, a second set of clouds can be drawn for the secondary range (if enabled).
Fibonacci Levels:
The script calculates Fibonacci retracement and extension levels based on the primary range (the difference between the Opening High and Opening Low).
Fibonacci levels can be used as entry and exit targets in a trading strategy, as these levels often act as potential support/resistance zones.
Fibonacci levels include standard values like -0.236, -0.382, -0.618, and positive extensions like 1.236, 1.618, etc.
Customizable Alerts:
Alerts can be set to trigger when:
The price crosses above the Opening High.
The price crosses below the Opening Low.
The price crosses the Opening Midpoint.
These alerts can help traders act quickly on important price movements relative to the opening range.
Customization Options:
The indicator allows users to adjust the time settings for both the primary and secondary ranges.
Custom colors can be set for the lines, clouds, and Fibonacci levels.
The visibility of each line and cloud can be toggled on or off, giving users flexibility in how the chart is displayed.
Fibonacci Levels Overview:
The script includes several Fibonacci retracement and extension levels:
Negative Retracements (e.g., -0.236, -0.382, -0.50, -0.618, etc.) are plotted below the Opening Low, and can act as potential support levels in a downtrend.
Positive Extensions (e.g., 1.236, 1.382, 1.618, 2.0, etc.) are plotted above the Opening High, and can act as potential resistance levels in an uptrend.
Fib levels can be used as entry and exit targets to capitalize on price reversals or breakouts.
Safety Warning:
This script is for educational and informational purposes only and is not intended as financial advice. While it provides valuable technical information about price ranges and Fibonacci levels, trading always involves risk. Users are encouraged to:
Paper trade or use a demo account before applying this indicator with real capital.
Use proper risk management strategies, including stop-loss orders, to protect against unexpected market movements.
Understand that no trading strategy, indicator, or tool can guarantee profits, and losses can occur.
Important: The creator, TenAMTrader, and TradingView are not responsible for any financial losses resulting from the use of this script. Always trade responsibly, and ensure you fully understand the risks involved in any trading strategy.

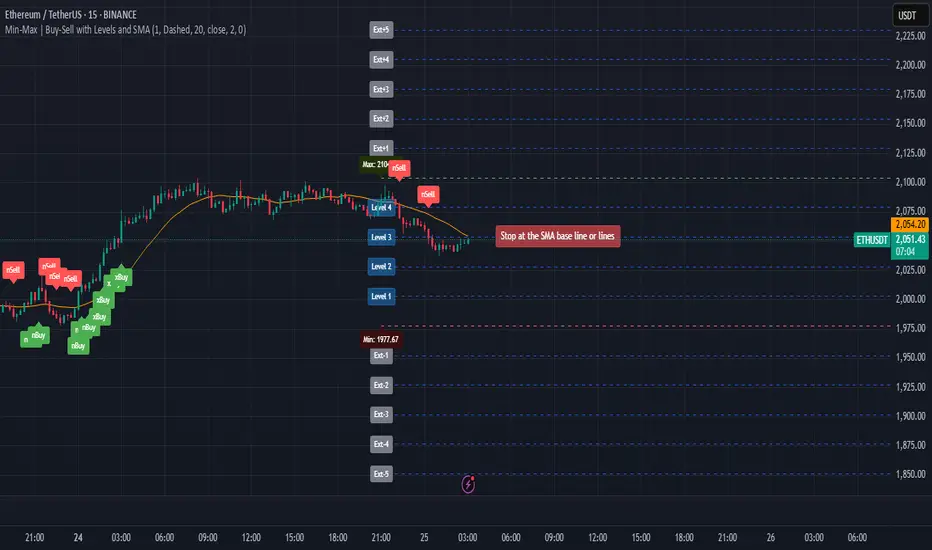
Min-Max | Buy-Sell Alert with LevelsMin-Max | Buy-Sell Alert with Levels
Description:
The Min-Max | Buy-Sell Alert with Levels indicator is a powerful tool designed to help traders identify key levels of support and resistance based on the previous day's high and low prices. It plots horizontal lines for the previous day's minimum (Min) and maximum (Max) prices, along with four intermediate levels (Stop Loss 1 to Stop Loss 4) calculated as equal percentage steps between the Min and Max.
This indicator is perfect for traders who want to:
Identify potential entry points when the price returns within the Min-Max range.
Set stop-loss levels based on the calculated intermediate levels.
Receive alerts for buy, sell, and stop-loss conditions.
Key Features:
Previous Day's Min and Max Lines:
Automatically plots the Min (red line) and Max (green line) of the previous day.
These levels act as dynamic support and resistance zones.
Intermediate Stop Loss Levels:
Calculates and plots four intermediate levels (Stop Loss 1 to Stop Loss 4) between the Min and Max.
Each level is equally spaced, representing potential stop-loss or take-profit zones.
Customizable Alerts:
Buy Alert: Triggered when the price returns within the Min-Max range after breaking below the Min.
Sell Alert: Triggered when the price returns within the Min-Max range after breaking above the Max.
Stop Loss Alerts: Triggered when the price reaches any of the four intermediate levels (Stop Loss 1 to Stop Loss 4).
Customizable Appearance:
Adjust the thickness, color, and style (solid, dashed, dotted) of the lines.
Customize the colors of the Stop Loss labels for better visualization.
Labels on the Chart:
Displays "Buy" and "Sell" labels on the chart when the respective conditions are met.
Labels for Stop Loss levels are also displayed for easy reference.
How to Use:
Add the indicator to your chart.
Customize the settings (line colors, thickness, and alert preferences) in the indicator's settings panel.
Use the Min and Max lines as dynamic support and resistance levels.
Monitor the intermediate levels (Stop Loss 1 to Stop Loss 4) for potential stop-loss or take-profit zones.
Set up alerts for Buy, Sell, and Stop Loss conditions to stay informed about key price movements.
Why Use This Indicator?
Simple and Effective: Focuses on the most important levels from the previous day.
Customizable: Tailor the indicator to match your trading style and preferences.
Alerts: Never miss a trading opportunity with customizable alerts for key conditions.
Settings:
Line Thickness: Adjust the thickness of the Min, Max, and intermediate lines.
Line Colors: Customize the colors of the Min, Max, and intermediate lines.
Line Style: Choose between solid, dashed, or dotted lines.
Stop Loss Label Colors: Customize the colors of the Stop Loss labels.
Alerts: Enable or disable alerts for Buy, Sell, and Stop Loss conditions.
Ideal For:
Day traders and swing traders.
Traders who rely on support and resistance levels.
Anyone looking for a clear and customizable tool to identify key price levels.
Disclaimer:
This indicator is for educational and informational purposes only. It does not constitute financial advice. Always conduct your own analysis and trade responsibly.
Get Started Today!
Add the Min-Max | Buy-Sell Alert with Levels indicator to your chart and take your trading to the next level. Customize it to fit your strategy and never miss a key trading opportunity again!
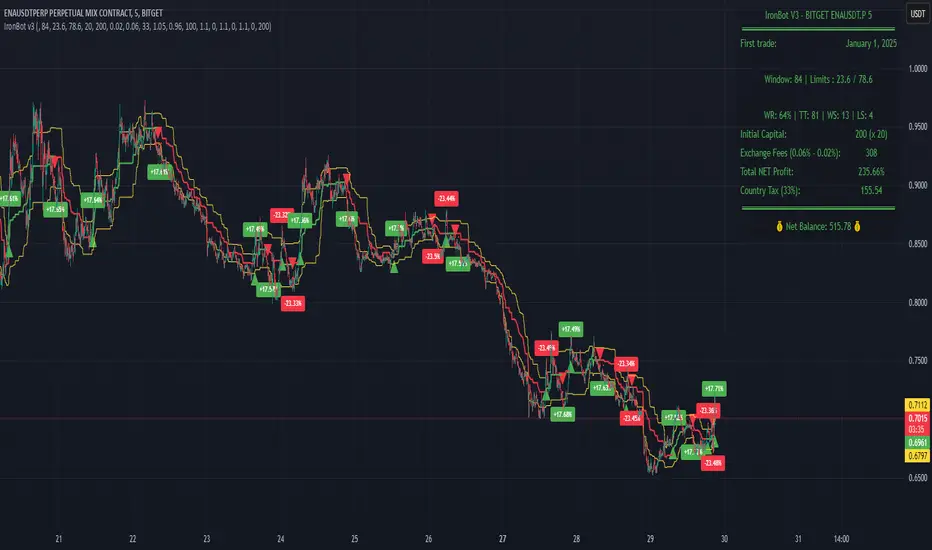
IronBot v3Introduction
IronBot V3 is a TradingView indicator that analyzes market trends, identifies potential trading opportunities, and helps manage trades by visualizing entry points, stop-loss levels, and take-profit targets.
How It Works
The indicator evaluates price action within a specified analysis window to determine market trends. It uses Fibonacci retracement levels to identify key price levels for trend detection and trading signals. Based on user-defined inputs, it calculates and displays trade levels, including entry points, stop-loss, and multiple take-profit levels.
Trend Definition:
The highest high and lowest low are calculated over a specified number of candles.
The price range is determined as the difference between the highest high and lowest low.
Three Fibonacci levels are calculated within this range:
- Fib Level 0.236
- Trend Line (0.5 level)
- Fib Level 0.786
Determining Long and Short Conditions:
Long Conditions (Buy):
The closing price must be above both the trend line (0.5 level) and the Fib Level 0.236.
Additionally, the market must not currently be in a bearish trend.
Short Conditions (Sell):
The closing price must be below both the trend line and the Fib Level 0.786.
The market must not currently be in a bullish trend.
Trend State Updates:
When a condition is met, the indicator sets the trend to bullish or bearish and turns off bearish or bullish trend conditions.
If neither buy nor sell conditions are met, the trend remains unchanged, and no new trade signals are generated.
Inputs and Their Role in the Algorithm
General Settings
Analysis Window: Specifies the number of historical candles to analyze. This influences the calculation of key levels such as highs and lows, which are critical for determining Fibonacci retracement levels.
First Trade: Defines the start date for generating trading signals.
Trade Configuration
Display TP/SL: Enables or disables the visualization of take-profit and stop-loss levels on the chart.
Leverage: Defines the leverage applied to trades for risk and position size calculations.
Initial Capital: Specifies the starting capital, which is used for calculating position sizes and profits.
Exchange Fees (%): Sets the percentage of fees applied by the exchange, which is factored into profit calculations.
Country Tax (%): Allows users to define applicable taxes, which are subtracted from net profits.
Stop-Loss Configuration
Break Even: Toggles the break-even functionality. When enabled, the stop-loss level adjusts dynamically as take-profit levels are reached.
Stop Loss (%): Defines the percentage distance from the entry price to the stop-loss level.
Take-Profit Settings
The indicator supports up to four take-profit levels:
- TP1 through TP4 Ratios: Specify the price levels for each take-profit target as a percentage of the entry price.
- Profit Percentages: Allocate a percentage of the position size to each take-profit level.
Visualization Elements
Trend Indicators: Displays Fibonacci-based trend lines and markers for bullish or bearish conditions.
Trade Levels: Entry, stop-loss, and take-profit levels are visualized on the chart by dotted lines for clarity. Additionally, a semi-transparent background is applied when a portion of the trade is closed to enhance visualization. Positive profits from a closed trade are green; otherwise, they are red.
Trade Profit Indicator: On each trade, every time a part of the trade is closed (e.g., take profit is reached), the profit indicator will be updated.
Performance Panel: Summarizes key account statistics, including net balance, profit/loss, and trading performance metrics.
Usage Guidelines
Add the indicator to your TradingView chart.
Configure the input settings based on your trading strategy.
Use the displayed levels and trend signals to make informed trading decisions.
Contact
For further assistance, including automation inquiries, feel free to contact me through TradingView’s messaging system.
Purpose and Disclaimer
IronBot V3 is designed for educational purposes and to assist in analyzing market trends. It is not financial advice, and users should perform their own due diligence before making any trading decisions.
Trading involves significant risk, and past performance is not indicative of future results. Use this indicator responsibly.
Simple Fibonacci Retracement Strategy This strategy uses Fibonacci retracement to identify key levels in the market and helps traders find good entry and exit points. By understanding and using this strategy, traders can improve their trading decisions and increase their chances of success in the market.
This strategy, called the "Simple Fibonacci Retracement Strategy," is designed to help traders identify potential entry and exit points in the market based on Fibonacci retracement levels. The code is written in Pine Script and runs on the TradingView platform.
Overall Function
The strategy uses Fibonacci retracement levels to identify potential support and resistance levels in the market. This helps traders find good entry and exit points for trades, as well as set stop-loss and take-profit levels to minimize risk and maximize gains.
Main Components of the Code
1. Input Parameters
Lookback Period: The number of bars used to identify the highest high and lowest low.
Fibonacci Direction: The choice of whether Fibonacci levels are calculated from top to bottom or bottom to top.
Fibonacci Levels: Specific Fibonacci levels (23.6%, 38.2%, 50%, 61.8%) used to identify important price levels.
Take Profit and Stop Loss: The number of pips used to set take profit and stop loss levels.
2. Identification of Highest and Lowest Points
The code uses the lookback period to find the highest high (highestHigh) and the lowest low (lowestLow). These levels form the basis for calculating the Fibonacci levels.
3. Calculation of Fibonacci Levels
Based on the direction chosen by the user, the code calculates the various Fibonacci levels (0%, 23.6%, 38.2%, 50%, 61.8%, 100%).
4. Trading Logic
Long Signal: Generated when the price crosses above the 61.8% Fibonacci level from bottom to top.
Short Signal: Generated when the price crosses below the 38.2% Fibonacci level from top to bottom.
When a long or short signal is generated, the strategy opens a position and sets take profit and stop loss levels based on the input parameters.
5. Visualization
The strategy plots the Fibonacci levels on the chart to provide a visual representation of the calculated levels. This helps traders see where the levels are in relation to the current price.
6. Alerts
The code also has functionality to create alerts (commented out), which can notify traders of buy or sell signals.
How to Use the Strategy
Configure Parameters: Adjust the lookback period, Fibonacci direction, and levels for take profit and stop loss to your preferences.
View the Chart: The Fibonacci levels will be plotted on the chart, providing a visual overview of potential support and resistance levels.
Trade Signals: Follow the generated buy and sell signals. Set your parameters in settings and adjust according to the generated buy and sell signals in the strategy tester. The strategy will automatically set your take profit and stop loss levels.
Evaluation and Adjustment: Monitor the performance of the strategy and make adjustments as needed to optimize the results.
Norwegian
Denne strategien, kalt "Simple Fibonacci Retracement Strategy", er designet for å hjelpe tradere med å identifisere mulige inngangs- og utgangspunkter i markedet basert på Fibonacci-retracementnivåer. Koden er skrevet i Pine Script og kjøres på TradingView-plattformen.
Overordnet Funksjon
Strategien bruker Fibonacci-retracementnivåer for å identifisere potensielle støtte- og motstandsnivåer i markedet. Dette hjelper tradere med å finne gode inngangs- og utgangspunkter for handler, samt å sette stop-loss og take-profit nivåer for å minimere risiko og maksimere gevinster.
Hovedkomponenter i Koden
1. Input Parametere
Lookback Period: Antall barer som brukes til å identifisere høyeste høydepunkt og laveste lavpunkt.
Fibonacci Direction: Valg om Fibonacci-nivåene skal beregnes fra topp til bunn eller bunn til topp.
Fibonacci Levels: Spesifikke Fibonacci-nivåer (23.6%, 38.2%, 50%, 61.8%) som brukes til å identifisere viktige prisnivåer.
Take Profit og Stop Loss: Antall pips som brukes til å sette take profit og stop loss nivåer.
2. Identifikasjon av Høyeste og Laveste Punkt
Koden bruker lookback perioden for å finne det høyeste høydepunktet (highestHigh) og det laveste lavpunktet (lowestLow). Disse nivåene er grunnlaget for å beregne Fibonacci-nivåene.
3. Beregning av Fibonacci-nivåer
Basert på retningen valgt av brukeren, beregner koden de forskjellige Fibonacci-nivåene (0%, 23.6%, 38.2%, 50%, 61.8%, 100%).
4. Handelslogikk
Long Signal: Genereres når prisen krysser over 61.8% Fibonacci-nivået fra bunn til topp.
Short Signal: Genereres når prisen krysser under 38.2% Fibonacci-nivået fra topp til bunn.
Når et long eller short signal genereres, åpner strategien en posisjon og setter take profit og stop loss nivåer basert på inputparametrene.
5. Visualisering
Strategien plottet Fibonacci-nivåene på chartet for å gi en visuell representasjon av de beregnede nivåene. Dette hjelper tradere med å se hvor nivåene er i forhold til den nåværende prisen.
6. Varsler
Koden har også funksjonalitet for å lage varsler (kommentert ut), som kan varsle tradere om kjøps- eller salgssignaler.
Slik Bruker Du Strategien
Konfigurer Parametere: Juster lookback perioden, Fibonacci-retningen, og nivåene for take profit og stop loss til dine preferanser.
Se på Chartet: Fibonacci-nivåene vil bli plottet på chartet, noe som gir deg en visuell oversikt over potensielle støtte- og motstandsnivåer.
Handle Signaler: Sett dine parametere i innstillinger og juster etter genererte kjøps- og salgssignalene i strategy testeren. Strategien vil automatisk sette dine take profit og stop loss nivåer.
Evaluering og Justering: Overvåk ytelsen til strategien og gjør justeringer etter behov for å optimalisere resultatene.

Auto Fib GOLDEN TARGET Golden Target Auto Fib Indicator
Unlock the power of automatic Fibonacci analysis with the Golden Target Auto Fib Indicator. Designed for traders who want to effortlessly incorporate Fibonacci retracement levels into their strategy, this indicator dynamically calculates and plots key Fibonacci levels based on recent price action.
Key Features:
Automatic Fibonacci Levels: Automatically determines the critical Fibonacci retracement levels using the most recent high and low over a user-defined period.
Customizable Length: Adjust the period over which the Fibonacci levels are calculated to match your trading style and market conditions.
Dynamic Plotting: Fibonacci levels are plotted in real-time, reflecting current market conditions and potential support and resistance areas.
Color-Coded Levels: Distinguishes between different Fibonacci levels with distinct colors, making it easy to identify significant price points at a glance.
Target Labels (Optional): Optionally display labels next to the Fibonacci levels to help identify potential target zones and better visualize the key levels.
How It Works:
The Golden Target Auto Fib Indicator calculates Fibonacci retracement levels based on the highest high and lowest low over a specified length. The levels plotted include key Fibonacci ratios: 23.6%, 38.2%, 61.8%, and the 100% extension, providing valuable insights into potential support and resistance areas as well as price targets.
Usage:
Adjust Settings: Set the Length parameter to define the period over which Fibonacci levels are calculated.
Analyze Levels: Observe the plotted Fibonacci levels and their color-coded lines to identify potential price retracement zones and target areas.
Incorporate Into Strategy: Use these levels in conjunction with your trading strategy to make more informed decisions on entry and exit points.
Whether you're a day trader or a swing trader, the Golden Target Auto Fib Indicator simplifies Fibonacci analysis and integrates seamlessly into your TradingView charts, helping you make more precise trading decisions.
Get started today and enhance your technical analysis with the Golden Target Auto Fib Indicator!
Feel free to adjust the description according to the specific features or customization options of your indicator.

Pivot Points - [RealFact]Description:
The Pivot Points indicator is a powerful tool for identifying potential support and resistance levels based on previous price action. It calculates key pivot levels (P), along with support (S1, S2) and resistance (R1, R2) levels, which are used to forecast potential turning points in the market.
Key Features:
Pivot Calculation: Based on the previous period's high, low, and close prices.
Support and Resistance Levels: Three support (S1, S2) and three resistance (R1, R2) levels.
Customizable Timeframes: Applicable to various timeframes including daily, weekly, and monthly charts.
Visual Representation: Levels are clearly plotted on the chart, making it easy to identify key areas.
Trading Strategies: Useful for breakout, reversal, and trend-following strategies.
How to Use:
Identify Key Levels: Use the pivot point (P) to determine the general market trend.
Support and Resistance: Look for price reactions at S1, S2, R1 and R2 to find potential entry and exit points.
Combine with Other Indicators: Enhance analysis by combining with other technical indicators such as Moving Averages, RSI, or MACD.
Formula:
Pivot Point (P) = (High + Low + Close) / 3
Support 1 (S1) = 2P - High
Resistance 1 (R1) = 2P - Low
Support 2 (S2) = P - (High - Low)
Resistance 2 (R2) = P + (High - Low)
Best Practices:
Confirm with Volume: Look for volume confirmation when price approaches pivot levels.
Avoid False Breakouts: Be cautious of false breakouts and use other indicators to confirm price moves.

Gann Box (Zeiierman)█ Overview
The Gann Box (Zeiierman) is an indicator that provides visual insights using the principles of W.D. Gann's trading methods. Gann's techniques are based on geometry, astronomy, and astrology, and are used to predict important price levels and market trends. This indicator helps traders identify potential support and resistance levels, and forecast future price movements.
Gann used angles and various geometric constructions to divide time and price into proportionate parts. Gann indicators are often used to predict areas of support and resistance, key tops and bottoms, and future price moves.
█ How It Works
The indicator operates by identifying high and low points within a visible range on the chart and drawing a Gann Box between these points. The box is divided into segments based on selected percentages, which represent key levels for observing market reactions. It includes options to display labels, a Gann fan, and Gann angles for analysis. Advanced features allow extending the box into the future for predictive analysis and reversing its orientation for alternative viewpoints.
High and Low Points Identification: It starts by locating the highest and lowest price points visible on the chart.
Gann Box Construction: Draws a box from these points and divides it according to specified percentages, highlighting potential support and resistance levels.
█ How to Use
Support and Resistance Levels
Using a Gann angle to forecast support and resistance is probably the most popular way they are used. This technique frames the market, allowing the analyst to read the movement of the market inside this framework.
The lines within the Gann Box, drawn at the key percentages, create a grid of potential support and resistance levels. As prices fluctuate, these lines can act as barriers to price movement, with the price often pausing or reversing at these intervals.
Forecasting with the 'Extend' Feature: The indicator's ability to extend lines and boxes into the future provides traders with a forward-looking tool to anticipate potential market movements and prepare for them.
Gann Fan: This feature draws lines at a significant price angle, helping traders identify potential support and resistance levels based on the theory that prices move in predictable patterns.
Gann Curves: Gann Curves display dynamic support and resistance levels, aiding in the analysis of momentum and trend strength.
█ Settings
The indicator includes several settings that allow customization of its appearance and functionality:
⚪ General Settings
Reverse: This setting changes the orientation of labels and calculations within the Gann Box, providing alternative analytical perspectives. It essentially flips the Gann Box's direction, which can be useful in different market conditions or analysis scenarios.
Extend: Extends the drawing of Gann lines or boxes into the future beyond the current last bar. This feature is essential for forecasting future price movements and identifying potential support or resistance levels that lie outside the current price action.
⚪ Gann Box
Show Box: Toggles the visibility of the Gann Box on the chart. The Gann Box is a fundamental tool in Gann analysis, highlighting key levels based on selected high and low points to identify potential support and resistance areas.
Show Fibonacci Labels: Controls the display of Fibonacci labels within the Gann Box. These labels mark specific Fibonacci retracement levels, aiding traders in recognizing significant levels for potential reversals.
Box Visibility: Allows users to enable or disable individual boxes within the Gann Box, providing flexibility in focusing on specific levels of interest.
Percentage Levels: Defines the Fibonacci levels within the Gann Box. Traders can adjust these levels to customize the Gann Box according to their specific analysis needs.
Coloring: Customizes the color of each level within the Gann Box, enhancing visual clarity and differentiation between levels.
⚪ Gann Fan
Show Fan: Enables the Gann Fan, which draws lines at significant Gann angles from a particular point on the chart, helping identify potential support and resistance levels.
Fan Percentages and Coloring: Similar to the Gann Box, these settings allow traders to customize which Gann angles are displayed and how they are colored.
⚪ Gann Curves
Show Curves: When enabled, this setting draws Gann Curves on the chart. These curves are based on Gann percentages and provide a dynamic view of support and resistance levels as they adapt to changing market conditions.
Curve Percentages and Coloring: Define which curves are displayed and their colors, allowing for a tailored analysis experience.
⚪ Gann Angles
Show Angles: Toggles the display of Gann Angles, which are crucial for understanding the market's price and time dynamics, offering insights into future support and resistance levels.
Coloring: Customizes the color of the Gann Angles, making it easier to differentiate between various angles on the chart.
█ Alerts
The indicator includes several alert conditions for price breakouts from the Gann Box and specific levels, enabling traders to be notified of significant market movements.
-----------------
Disclaimer
The information contained in my Scripts/Indicators/Ideas/Algos/Systems does not constitute financial advice or a solicitation to buy or sell any securities of any type. I will not accept liability for any loss or damage, including without limitation any loss of profit, which may arise directly or indirectly from the use of or reliance on such information.
All investments involve risk, and the past performance of a security, industry, sector, market, financial product, trading strategy, backtest, or individual's trading does not guarantee future results or returns. Investors are fully responsible for any investment decisions they make. Such decisions should be based solely on an evaluation of their financial circumstances, investment objectives, risk tolerance, and liquidity needs.
My Scripts/Indicators/Ideas/Algos/Systems are only for educational purposes!

Support and Resistance Breakout Signals [MarkitTick]💡 This indicator provides a comprehensive, automated system for identifying, tracking, and trading Support and Resistance (S/R) breakouts. By synthesizing classic Swing High and Swing Low pivot analysis with Multi-Timeframe (HTF) capabilities and Volume confirmation, it transforms raw price action into actionable structural data. It is designed to declutter charts by automatically managing active levels and highlighting significant market structure shifts (Higher Highs, Lower Lows) alongside verified breakout signals.
✨ Originality and Utility
While many indicators draw static pivot points, this tool distinguishes itself through "State Management." It treats Support and Resistance not just as historical markers, but as active zones that evolve.
Dynamic Level Management: Instead of flooding the chart with infinite lines, the script uses arrays to store a specific number of recent levels. As price action progresses, invalid or broken levels are removed or updated, keeping the analysis focused on current relevance.
Multi-Timeframe Confluence: Uniquely, it allows you to overlay higher timeframe support and resistance levels (e.g., Daily levels on a 4-hours chart) without changing your chart view, enabling top-down analysis instantly.
Market Structure Labeling: It automatically tags pivot points with Dow Theory labels (HH, LH, LL, HL), aiding traders in instantly recognizing trend direction without manual charting.
🔬 Methodology and Concepts
The script operates on three core technical pillars:
● Swing Pivot Detection
The foundation is the detection of local extrema using a "Left/Right" bar lookback mechanism. A Swing High is identified when a high is greater than the L bars preceding it and the R bars following it. This confirms a fractal peak or valley.
Note on Confirmation: Because the script waits for R bars to close to confirm a pivot, the lines appear retroactively. However, the extension of these lines and subsequent breakout signals occur in real-time.
● Breakout Logic with Volume Integration
A breakout is triggered when the Close price crosses an active S/R line.
Resistance Break: Current Close > Resistance Level (and Previous Close ≤ Level).
Support Break: Current Close < Support Level (and Previous Close ≥ Level).
Volume Confirmation: An optional filter requires the breakout bar's volume to exceed a Moving Average of volume, ensuring momentum backs the move.
● Time Decay
To mimic the reduced relevance of stale levels, the script includes a "Time Decay" feature. If a level is not interacted with for a user-defined number of bars, it is automatically purged from the system, ensuring the chart reflects only fresh interest levels.
🎨 Visual Guide
The indicator uses a specific color-coding and labeling system to convey information quickly:
● Support & Resistance Lines
Red Lines (Thin): Represent active Resistance levels on the current timeframe.
Green Lines (Thin): Represent active Support levels on the current timeframe.
Fuchsia Lines (Thick): Represent Higher Timeframe (HTF) Resistance levels.
Aqua Lines (Thick): Represent Higher Timeframe (HTF) Support levels.
● Market Structure Labels
Located at the pivot points, these text labels define the trend structure:
HH / LH: Higher High / Lower High (Red Text).
LL / HL: Lower Low / Higher Low (Green/Aqua Text).
HTF-R / HTF-S: Indicates major structural pivots from the higher timeframe.
● Breakout Signals
When a valid break occurs, a label appears above or below the bar:
Blue Triangle Up (▲): Bullish breakout through resistance.
Blue Triangle Down (▼): Bearish breakout through support.
Number in Label: Indicates the cumulative count of breaks for that specific trend sequence (e.g., "1" is the first break, "2" is the second).
The breakout count represents the intensity of the move. A reading greater than 1 signals exceptional market strength, indicating the penetration of multiple Key Levels (Support or Resistance) within a single candle.
📖 How to Use
Trend Continuation: In an uptrend (sequence of HH/HL), wait for a Blue Triangle Up (▲) occurring at a Red Resistance line. This signals the continuation of the trend.
Trend Reversal: Watch for a "Structure Break." If price is making Higher Highs, but then breaks a Green Support line (generating a ▼ signal) and forms a Lower Low (LL), the trend may be reversing.
HTF "Bounce" Plays: Use the thick Fuchsia/Aqua lines as major zones. If price approaches a thick Aqua line (HTF Support) and fails to break it, look for LTF bullish structure (HH/HL) to form for an entry.
Volume Filtering: Enable the "Volume Confirmation" setting to filter out "fakeouts" (breaks on low volume).
⚙️ Inputs and Settings
● Swing Settings
Left/Right Bars: Determines the sensitivity of the pivot detection. Higher numbers = fewer, more significant pivots.
Max Stored Levels: How many S/R lines to keep in memory at once.
Max Break Labels: Limits visual clutter by capping the number of signal labels.
● Usability & HTF
Enable Time Decay: If true, deletes lines that are older than "Decay Period" bars.
Enable HTF Levels: Toggles the display of higher timeframe pivots.
HTF Timeframe: Select the specific timeframe for the macro view (e.g., "D" for Daily).
● Analysis
Volume Confirmation: Toggles the requirement for volume to be above its average for a signal to fire.
Show Market Structure: Toggles the HH/LL text labels.
🔍 Deconstruction of the Underlying Scientific and Academic Framework
The script's logic is rooted in Fractal Geometry and Auction Market Theory .
● Mandelbrot's Fractals: The use of `leftBars` and `rightBars` is a direct application of identifying market fractals. Markets are self-similar across timeframes; a pivot on a 5-minute chart is structurally identical to one on a Weekly chart. This script exploits this property by allowing nested timeframe analysis (LTF inside HTF).
● Memory of Price (Behavioral Finance): Support and resistance lines represent zones where market participants have previously established value (Price Memory). The "Breakout" signal is mathematically significant because it represents a shift in the supply/demand equilibrium. When price closes beyond a stored array value (the pivot price), it signifies that the aggressive limit orders that created the pivot have been exhausted or withdrawn, validating a new search for value.
⚠️ Disclaimer
All provided scripts and indicators are strictly for educational exploration and must not be interpreted as financial advice or a recommendation to execute trades. I expressly disclaim all liability for any financial losses or damages that may result, directly or indirectly, from the reliance on or application of these tools. Market participation carries inherent risk where past performance never guarantees future returns, leaving all investment decisions and due diligence solely at your own discretion.

Session Opening Bar RangeSession Opening Bar Range (OBR) - Advanced Opening Range Indicator with Statistical Analysis
Overview
The Session First Bar Range (FBR) indicator is a comprehensive tool that captures and projects key levels based on the first bar of a user-defined trading session. Unlike traditional daily opening range indicators, this script allows traders to focus on specific session windows (New York RTH, London, Asia, etc.) and analyze price behavior relative to the initial momentum established in that session's opening bar.
What makes this indicator unique is its combination of three distinct projection methodologies: statistical analysis based on historical range data, Fibonacci extensions, and fixed-point rotation levels commonly used by institutional traders. To our knowledge, this is the only opening range indicator that incorporates statistical standard deviation levels calculated from historical first bar ranges, making it both a technical and probabilistic tool.
Core Concept
The opening range concept is based on the principle that the initial price action of a trading session often sets the tone for the remainder of that session.
Professional traders have long observed that:
The first bar's high and low act as key reference points
Price often respects or breaks these levels with significance
Expansion beyond the opening range tends to occur in measurable increments
This indicator takes these observations and enhances them with:
Historical probability analysis - "Based on the last 60 sessions, price typically extends X standard deviations beyond the opening range"
Proportional projections - Fibonacci-based extensions showing where measured moves typically target
Fixed-point rotations - Institutional rotation levels (e.g., 65 points for NQ, 15 points for ES)
How It Works
Session Detection & First Bar Capture
The indicator uses Pine Script's time() function with timezone support to precisely detect when a trading session begins. When the first bar of the selected timeframe occurs within the session window, the script captures:
High (H): The high of the first bar
Low (L): The low of the first bar
Mid (M): The midpoint (hl2) of the first bar
Critical Detail: These levels are fixed from the first bar only - they do not update as the session progresses. This differs from many "opening range" indicators that use a time period (e.g., first 30 minutes). Here, you select the bar timeframe (default 5-minute), and only that single first bar's range is captured.
Statistical Level Calculation
The indicator maintains a rolling array of the last N session's first bar ranges (default: 60 sessions). For each new session, it calculates:
Average Range: Mean of historical first bar ranges
Standard Deviation: Volatility of those ranges
Projection Levels: High/Low ± (Average Range + Std Dev × Multiplier)
This provides probability-based levels. For example, a +2σ level suggests: "Historically, price extending this far beyond the opening range is a 2-standard-deviation event (approximately 95th percentile)."
Fibonacci Extensions
Using the first bar range as the base unit (100%), the indicator projects Fibonacci levels:
100% extension: One full range above the high / below the low
1.618x extension: (Default) Golden ratio projection
2.618x, 3.618x extensions: Additional Fibonacci levels
Calculation: Range = H - L, then Target = H + (Range × Multiplier) for upside projections.
OR Rotation Levels
These are fixed-point increments from the first bar's high and low. Unlike percentage-based methods, rotations use absolute point values:
NQ traders often use 65-point increments
ES traders often use 15-point increments
Gold/bonds use different values
The indicator draws 5 levels above the high (R+1 through R+5) and 5 below the low (R-1 through R-5), each separated by your specified point increment.
Features:
Session Options
Pre-configured Sessions:
New York RTH (9:30am - 4:00pm)
New York Futures (8:00am - 5:00pm)
London (2:00am - 8:00am)
Asia (7:00pm - 2:00am)
Midnight to 5pm
ZB/Gold/Silver OR (8:20am - 4:00pm)
CL OR (9:00am - 4:00pm)
Custom Session: Define your own start/end times in HHMM format
Timezone Support: All sessions respect the selected timezone (default: America/New_York)
Customizable Timeframe
Select any timeframe for the first bar (1min, 5min, 15min, etc.)
Default: 5-minute bars
Important: This is the timeframe for the first bar capture, independent of your chart's timeframe
Display Options
Historical Ranges: Show/hide past session ranges (with configurable limit to manage performance)
Line Styles: Choose between Solid, Dashed, or Dotted for range lines and midline
Label Position: Left or Right side of range
Show Prices: Optionally display actual price values on labels
Custom Colors: Fully customizable colors for all components
Statistical Levels
Lookback Period: Number of historical sessions to analyze (default: 60)
Two Multiplier Levels: Default 1σ and 2σ, fully adjustable
Separate styling: Different line styles (dashed vs dotted) for each sigma level
Optional Labels: Show/hide sigma notation labels
Fibonacci Extensions
Four Extension Levels: 100%, 1.618x, 2.618x, 3.618x (all customizable)
Bidirectional: Projections both above and below the opening range
Optional Labels: Toggle percentage/multiplier labels
OR Rotation Levels
Configurable Increment: Set the point value for your instrument
Five Levels Each Direction: R±1 through R±5
Dynamic Labels: Show both rotation number and point value (e.g., "R+1 (65)")
Three Line Styles: Solid, Dashed, or Dotted
How to Use
Setup
Add the indicator to your chart
Select your trading session from the dropdown
Set the timeframe for first bar capture (typically 5-15 minutes)
Configure which projection methods you want to see (Statistical, Fibonacci, and/or Rotations)
For Day Traders
Scenario: Trading NQ during New York RTH
Session: Select "New York RTH (9:30am - 4:00pm)"
Timeframe: 5-minute (captures 9:30-9:35 bar)
Enable: OR Rotations with 65-point increments
Strategy:
Watch for acceptance/rejection at rotation levels
Use R+1/R-1 as initial profit targets
R+2/R-2 as extended targets
Statistical levels show when price is in "outlier" territory
and rotation levels
Performance Notes
The indicator limits objects to stay within TradingView's constraints (500 max)
If you enable all features, reduce "Maximum Historical Ranges" to prevent slowdown
Typical configuration: 10-20 historical ranges with all features enabled works well
Settings Guide
Session Settings
Session: Choose from pre-configured sessions or "Custom"
Custom Session Start/End: HHMM format (e.g., "0930" for 9:30am)
Timezone: Critical for accurate session detection
Opening Bar Format
Timeframe: The bar size for capturing the first bar's range
Show Midline: Toggle the mid-point line
Show Historical Ranges: Display previous sessions (recommended: leave ON)
Maximum Historical Ranges: Limit history to manage performance (1-500)
Range Style / MidLine Style: Solid, Dashed, or Dotted
Position: Label placement (Left or Right)
Show Prices: Include actual price values on labels
Statistical Levels
Lookback Periods: How many historical first bar ranges to analyze (default: 60)
Std Dev Multiplier 1/2: The sigma levels to project (default: 1.0 and 2.0)
All visual settings (colors, line width, label size)
Fibonacci Extensions
Show Fib Extensions: Enable/disable Fibonacci projections
Measured Move Extensions 1-4: The multipliers (default: 1.618, 2.618, 3.618, 4.618)
Visual customization options
OR Rotations
Rotation Increment: The point value for your instrument
NQ: 65 points
ES: 15 points
Adjust for other instruments based on their typical rotation behavior
Show Rotation Labels: Display level numbers and point values
Visual customization options
Use Cases
Gap Trading: When price gaps away from previous day's close, the first bar range shows the initial gap acceptance/rejection zone
Breakout Confirmation: Price breaking and holding above the first bar high with volume suggests trend day potential. Rotation levels provide measured targets.
Reversal Identification: Price reaching +2σ statistical level = rare event, potential exhaustion
Range Bound Days: Price oscillating between first bar high/low suggests range-bound session; trade reversals at extremes
Institutional Level Awareness: OR Rotations at 65 points (NQ) align with levels professional traders watch
Technical Notes
The indicator uses request.security() with lookahead=barmerge.lookahead_on to ensure the first bar levels are captured correctly
All drawing objects (lines, labels, fills) are managed in arrays with automatic cleanup to prevent memory issues
The statistical calculations use array.avg() and array.stdev() for accurate probability estimates
Rotation levels use individual line variables (like Fibonacci) rather than loops for reliability
Summary
This indicator is original in its combination of three distinct methodologies for projecting levels from a session's opening range:
Statistical Analysis - No other opening range indicator (to our knowledge) calculates standard deviation projections from historical first bar ranges
Time-Based Session Flexibility - Most OR indicators use only daily or fixed time periods; this allows any custom session window
Multiple Projection Methods - Traders can use statistical, Fibonacci, AND rotation levels together or separately

Dynamic Liquidity Levels [CDC Trading LABN] (ENGLISH)Script Description :
Take your market structure and liquidity analysis to the next level with Dynamic Liquidity Levels, a professional-grade tool designed to visualize the key levels that truly move the price. This indicator doesn't just plot static lines; it offers a dynamic framework that reacts to price action in real-time, keeping your chart clean and focused on what matters.
Designed for scalpers and swing traders alike, this indicator is your map for navigating market liquidity.
Key Features
• Smart Dynamic Lines: The standout feature of this indicator. Lines automatically stop extending once price has "invalidated" them. You decide whether the break occurs on a simple wick touch (to capture liquidity grabs) or a full candle close beyond the level (for a stronger confirmation).
• Comprehensive Liquidity Levels: Automatically draws the most important liquidity pools that professional traders watch every day:
• HTF Levels: Previous Day, Week, and Month Highs & Lows (PDH/L, PWH/L, PMH/L).
• Session Levels: Asian, London, and New York Session Highs & Lows (ASH/L, LSH/L, NYH/L).
• Full Label Control: Forget about overlapping labels. Adjust the position of each label individually (Left, Right, Center, Upper, Lower) for perfect visual clarity in any market condition.
• Instant, Configurable Alerts: Never miss an opportunity. Set up alerts that trigger the moment a level of your choice is broken, helping you execute your trades with precision.
• Clean & Professional Visualization: Fully customizable. Adjust colors, line width, and decide whether to display exact prices in the labels for an analysis setup tailored to your style.
Who is This Indicator For?
This tool is essential for a wide range of trading methodologies:
• Smart Money Concepts (SMC) & ICT Traders: Perfect for identifying liquidity pools and draw on liquidity levels. Use it to frame your order blocks and points of interest.
• Candle Range Theory (CRT) Traders: This indicator automates the core of your analysis. It identifies and projects the key candle ranges from higher timeframes (Daily, Weekly, Monthly) and trading sessions. Use these levels to anticipate price expansion and identify liquidity targets above and below established ranges, without manual markup every day.
• Price Action Traders: Clearly and automatically visualize the most relevant support and resistance levels based on high-timeframe market structure.
• Day Traders & Scalpers: Make quick decisions based on previous day's levels and session highs/lows, which act as magnets for intraday price.
• Swing Traders: Use the weekly and monthly levels to get a macro view of the structure and plan longer-term trades.
How to Use
1. Add the indicator to your chart.
2. Explore the settings panel to enable the levels and alerts that fit your trading plan.
3. Adjust the label positions for maximum clarity.
4. To receive alerts, right-click on the chart, create a new alert, select the indicator from the dropdown, and choose the "Any alert() function call" option.
We hope this tool greatly helps you improve your market analysis.
Happy trading!
CDC Trading LABN

Dynamic Liquidity Levels [CDC Trading LABN] (ESPAÑOL)Script Description :
Take your market structure and liquidity analysis to the next level with Dynamic Liquidity Levels , a professional-grade tool designed to visualize the key levels that truly move the price. This indicator doesn't just plot static lines; it offers a dynamic framework that reacts to price action in real-time, keeping your chart clean and focused on what matters.
Designed for scalpers and swing traders alike, this indicator is your map for navigating market liquidity.
Key Features
• Smart Dynamic Lines: The standout feature of this indicator. Lines automatically stop extending once price has "invalidated" them. You decide whether the break occurs on a simple wick touch (to capture liquidity grabs) or a full candle close beyond the level (for a stronger confirmation).
• Comprehensive Liquidity Levels: Automatically draws the most important liquidity pools that professional traders watch every day:
• HTF Levels: Previous Day, Week, and Month Highs & Lows (PDH/L, PWH/L, PMH/L).
• Session Levels: Asian, London, and New York Session Highs & Lows (ASH/L, LSH/L, NYH/L).
• Full Label Control: Forget about overlapping labels. Adjust the position of each label individually (Left, Right, Center, Upper, Lower) for perfect visual clarity in any market condition.
• Instant, Configurable Alerts: Never miss an opportunity. Set up alerts that trigger the moment a level of your choice is broken, helping you execute your trades with precision.
• Clean & Professional Visualization: Fully customizable. Adjust colors, line width, and decide whether to display exact prices in the labels for an analysis setup tailored to your style.
Who is This Indicator For?
This tool is essential for a wide range of trading methodologies:
• Smart Money Concepts (SMC) & ICT Traders: Perfect for identifying liquidity pools and draw on liquidity levels. Use it to frame your order blocks and points of interest.
• Candle Range Theory (CRT) Traders: This indicator automates the core of your analysis. It identifies and projects the key candle ranges from higher timeframes (Daily, Weekly, Monthly) and trading sessions. Use these levels to anticipate price expansion and identify liquidity targets above and below established ranges, without manual markup every day.
• Price Action Traders: Clearly and automatically visualize the most relevant support and resistance levels based on high-timeframe market structure.
• Day Traders & Scalpers: Make quick decisions based on previous day's levels and session highs/lows, which act as magnets for intraday price.
• Swing Traders: Use the weekly and monthly levels to get a macro view of the structure and plan longer-term trades.
How to Use
1. Add the indicator to your chart.
2. Explore the settings panel to enable the levels and alerts that fit your trading plan.
3. Adjust the label positions for maximum clarity.
4. To receive alerts, right-click on the chart, create a new alert, select the indicator from the dropdown, and choose the "Any alert() function call" option.
We hope this tool greatly helps you improve your market analysis.
Happy trading!
CDC Trading LABN

BRT CHARTS MTFDescription of the Indicator
This indicator is designed to visualize and analyze price movements across multiple timeframes simultaneously. It displays candles from selected time intervals directly on the current chart, allowing traders to quickly assess market conditions without switching between different timeframes. This is particularly useful for traders who use multi-timeframe analysis to make trading decisions.
Key Features of the Indicator:
1. Displaying Candles from Multiple Timeframes:
- The indicator allows you to select three timeframes (e.g., 1 hour, 4 hours, and 1 day) and displays their candles on the current chart. This helps to see the overall market picture without switching between charts.
- Candles are displayed as vertical columns, each containing the body and wicks (shadows) of the candle. The colors of the candles (green for bullish and red for bearish) are customizable.
2. Dynamic Updates:
- The indicator automatically updates the candles as new data arrives, allowing you to track market changes in real time.
3. Customizable Number of Candles:
- The user can choose how many candles to display for each timeframe (default is 4 candles). This allows the indicator to be adapted to individual needs.
4. Range Display (High/Low):
- The indicator can show High and Low levels for each timeframe, helping to identify key support and resistance levels.
- It is also possible to display the Mid level (average between High and Low), which can be useful for identifying consolidation zones.
5. Data Table:
- The indicator supports displaying a table with key levels (High, Low, Mid) for each timeframe. The table can be placed in any corner of the chart, and its size and text/background colors are customizable.
6. Flexible Appearance Settings:
- The user can customize the colors of the candles, their wicks, High/Low/Mid levels, as well as the placement of the columns on the chart.
How the Indicator Helps in Trading:
- Multi-Timeframe Analysis: The indicator allows you to analyze multiple timeframes simultaneously, helping to better understand the overall trend and find entry points. For example, if the trend is bullish on the daily timeframe and there is a correction on the hourly timeframe, this could be a good opportunity to buy.
- Identifying Key Levels: Displaying High, Low, and Mid levels helps quickly identify support and resistance zones, which is useful for setting stop-loss and take-profit levels.
- Time-Saving: The indicator eliminates the need to switch between timeframes, speeding up the analysis and decision-making process.
- Visual Clarity: Visualizing candles from different timeframes on a single chart makes analysis more convenient and intuitive.
Example Use Cases:
1. Trend Trading: If a clear uptrend is visible on the daily timeframe and a correction is occurring on the hourly timeframe, you can look for buy opportunities near support levels.
2. Range Trading: If the price is moving sideways across all timeframes, you can use High and Low levels to trade from the boundaries of the range.
3. Identifying Reversal Points: If the price approaches a key resistance level on the higher timeframe and a bearish candle forms on the lower timeframe, this could be a signal to sell.
Conclusion:
This indicator is a powerful tool for traders who use multi-timeframe analysis. It helps quickly assess market conditions, identify key levels, and make informed trading decisions. Thanks to its flexible settings, the indicator can be adapted to any trading style and visualization preferences.
Day & Swing Trading EMA Clouds with Adaptive LevelsDay & Swing Trading EMA Clouds with Adaptive Levels is a tool designed for traders who need a flexible indicator that adapts to both short-term (day trading) and long-term (swing trading) strategies. The indicator blends EMA clouds and adaptive support/resistance levels, making it suitable for analyzing trend strength and key price zones.
How It Works:
EMA Clouds for Trend Detection:
This indicator uses three EMAs (Fast, Intermediate, Slow) to create two clouds:
Fast Cloud: The area between the fast and Intermediate EMAs.
Slow Cloud: The area between the Intermediate and slow EMAs.
The cloud colors change based on trend direction:
Positive (uptrend): When the fast EMA is above the Intermediate EMA (turquoise) or the Intermediate EMA is above the slow EMA (teal).
Negative (downtrend): When the fast EMA is below the Intermediate EMA (pink) or the Intermediate EMA is below the slow EMA (magenta).
Traders can use these clouds to visually gauge market momentum and trend reversals.
Adaptive EMA Settings Based on Trading Mode:
The EMA lengths adjust automatically depending on whether you're in Day Trading or Swing Trading mode:
Day Trading Mode uses shorter periods to capture quick price movements:
Fast EMA: 5-period
Mid EMA: 13-period
Slow EMA: 21-period
Swing Trading Mode uses longer periods to capture broader trends:
Fast EMA: 12-period
Mid EMA: 26-period
Slow EMA: 50-period
This dynamic adjustment allows you to switch between trading styles seamlessly, with the EMAs reflecting the most relevant timeframes for each strategy.
Adaptive Support and Resistance Levels:
Depending on the selected trading mode, the indicator dynamically plots key levels:
Day Trading Mode: Previous day’s high, low, and midpoint, as well as 2-day levels.
Swing Trading Mode: Previous month’s high, low, and midpoint, as well as 2-month levels.
These levels act as dynamic support and resistance zones, giving traders critical areas to monitor for potential reversals or breakouts.
Buy & Sell Signals:
Visual buy/sell signals are generated when the fast EMA crosses above or below the slow EMA. These signals can help traders identify potential trend reversals.
Customization:
You can fully adjust the transparency and colors of the clouds to fit your personal preferences and trading style.
Why This Combination?
Combining EMA clouds with adaptive levels provides traders with a complete picture. The clouds highlight the underlying market momentum and trend strength, while the adaptive levels offer potential entry/exit points based on historical price action. This unique mashup allows traders to follow trends and plan trades around key support and resistance zones.

NQ Hourly Retracements - 12y Stats with LevelsHour Stats with Levels - TradingView Indicator Description
IMPORTANT: NQ FUTURES ONLY
This indicator is specifically designed for and calibrated to NQ (Nasdaq-100 E-mini) futures only. The statistical data is derived exclusively from 13 years of NQ price action (2013-2025). Do not use this indicator on any other asset, ticker, or market as the statistics will not be applicable and may lead to incorrect trading decisions.
Overview
"Hour Stats with Levels" is a statistical analysis indicator that provides real-time probability-based insights into hourly price behavior patterns. The indicator combines historical pattern recognition with live price action to help traders anticipate potential sweep and reversal scenarios within each trading hour.
Originality and Core Concept
This indicator is based on a comprehensive statistical analysis of 12y years of 1-minute NQ futures data, examining a specific price pattern: when an hourly candle opens inside the previous hour's range. Unlike generic support/resistance indicators, this tool provides hour-specific, context-aware probabilities based on 30,000+ historical occurrences of this pattern.
The originality lies in three key areas:
Pattern-Specific Statistics: Rather than applying generic technical analysis, the indicator only activates when the current hour opens within the previous hour's range, providing relevant statistics for this exact scenario.
Context-Aware Probabilities: Statistics are differentiated based on whether the current hour opened above or below the previous hour's open, recognizing that bullish and bearish opening contexts produce different behavioral patterns.
Comprehensive Retracement Tracking: The indicator tracks four independent retracement levels after a sweep occurs, showing the probability of price returning to: the swept level itself (90+% probability), the 50% level, the current hour's open, and the opposite extreme.
How It Works
The Core Pattern
The indicator monitors a specific price structure:
Setup Condition: The current hourly candle opens inside (between) the previous hour's high and low
Sweep Event: Price then breaks above the previous high (high sweep) or below the previous low (low sweep)
Retracement Analysis: After a sweep, the indicator tracks whether price retraces to key levels
Statistical Foundation
The underlying analysis processed 1-minute bar data from 2013-2025, identifying every instance where an hourly candle opened inside the previous hour's range. For each occurrence, the system tracked:
Whether the high, low, or both were swept during that hour
The distance of the sweep measured as a percentage of the previous hour's range
Whether price retraced to four key levels: the swept level, the 50% point, the current open, and the opposite extreme
These measurements were aggregated for all 24 hours of the trading day, with separate statistics for bullish contexts (opening above previous open) and bearish contexts (opening below previous open), creating 48 unique statistical profiles.
Sweep Distance Percentiles
The "reversal levels" are drawn based on historical sweep distance distributions:
25th Percentile: 75% of historical sweeps were larger than this distance. This represents a conservative reversal zone where smaller, contained sweeps typically reverse.
Median (50th Percentile): The midpoint of all historical sweep distances. Half of all sweeps reversed before reaching this level, half extended beyond it.
75th Percentile: Only 25% of sweeps extended beyond this distance. This represents an extended sweep zone where price has historically shown exhaustion.
For example, if the previous hour's range was 20 points and the median high sweep distance is 40% of range, the median reversal level would be placed 8 points above the previous high.
How to Use the Indicator
Sweeps were calculated using 1m data - as such, it's recommended to use the indicator on a 1min chart
Visual Components
Hour Delimiter (Gray Vertical Line)
Marks the start of each new hour
Helps identify when new statistics become active
Sweep Markers
Green "H" label: High sweep has occurred this hour
Red "L" label: Low sweep has occurred this hour
Markers appear on the exact bar where the sweep happened
Target Levels (Blue Lines)
Prev Open: Previous hour's opening price
Prev High: Previous hour's highest price (sweep target)
Prev Low: Previous hour's lowest price (sweep target)
Prev 50%: Midpoint of previous hour's range
Current Open: Current hour's opening price (key retracement target)
Reversal Levels (Purple Dashed Lines)
Positioned beyond the previous high/low based on historical sweep percentiles
Three levels above previous high (for high sweeps)
Three levels below previous low (for low sweeps)
These represent statistically-derived zones where sweeps typically exhaust
The Statistics Table
The table dynamically updates each hour and displays different statistics based on whether the current hour opened above or below the previous hour's open.
Status Row
Shows current state: waiting for sweep, or which sweep(s) have occurred
If waiting, indicates which sweep is more probable based on historical data
SWEEP PROBABILITIES Section
High Sweep: Historical probability (%) that price will sweep the previous high this hour
Low Sweep: Historical probability (%) that price will sweep the previous low this hour
Both Sweeps: Historical probability (%) that price will sweep both levels this hour
These probabilities are derived from counting how many times each pattern occurred in similar historical contexts. For example, "High Sweep: 73.18%" means that in 73.18% of historical occurrences where the hour opened in this same context (same hour of day, same position relative to previous open), price swept the previous high before the hour closed.
AFTER HIGH SWEEP → Section
These statistics activate only after a high sweep has occurred. They show the probability of price retracing to various levels:
→ Prev High: Probability that price returns to (or below) the level it just swept. This is typically 90%+ because sweeps often act as "false breakouts" or liquidity grabs before reversal.
→ 50% Level: Probability that price retraces at least halfway back into the previous hour's range. This represents a moderate retracement.
→ Current Open: Probability that price retraces all the way back to where the current hour opened. This indicates a complete reversal of the sweep move.
→ Prev Low: Probability that price retraces entirely through the previous range to touch the opposite extreme. This represents a full reversal pattern.
AFTER LOW SWEEP → Section
Mirror of the above, but for low sweeps:
→ Prev Low: Retracement to the swept low level (90%+ probability)
→ 50% Level: Retracement to middle of range
→ Current Open: Full retracement to current hour's open
→ Prev High: Complete reversal to opposite extreme
Important Note on Retracement Statistics: These percentages are tracked independently. A 90% probability of returning to the swept level doesn't mean there's only a 10% chance of deeper retracement. Price can (and often does) retrace through multiple levels sequentially. The percentages show how many times price reached at least that level, not where it stopped.
Trading Applications
Anticipating Sweeps
When an hour opens inside the previous range, check the probabilities. If "High Sweep: 70%" and "Low Sweep: 30%", you know there's a 70% historical likelihood of an upside sweep occurring this hour. This doesn't guarantee it will happen, but provides statistical context for potential setups.
Reversal Trading
The most reliable pattern in the data is the 90%+ retracement probability to swept levels. When a sweep occurs, traders can anticipate a retracement back to at least the swept level in the vast majority of cases. The reversal level percentiles help identify where sweeps may exhaust.
Position Management
The retracement probabilities help manage existing positions. For example, if you're long and a high sweep occurs, you know there's a 90%+ chance of at least some retracement to the swept level, which might inform profit-taking or stop-loss decisions.
Confluence with Current Open
The "Current Open" retracement statistics (typically 60-70%) highlight the magnetic quality of the hour's opening price. After a sweep, price frequently returns to test this level.
Customization Options
The indicator offers extensive visual customization:
Toggle on/off: hour delimiters, sweep markers, target levels, reversal levels, statistics table
Customize colors, line widths, and styles for all visual elements
Adjust label sizes and table position
Show/hide individual target levels and reversal percentiles
Limitations and Considerations
Pattern-Specific: The indicator only provides statistics when the current hour opens inside the previous hour's range. If the hour opens outside this range (gaps up or down), the statistics are not applicable.
Historical Probabilities: The percentages represent historical frequencies, not predictions. A 70% probability means it happened 70% of the time historically, not that it will definitely happen 7 out of 10 times going forward.
NQ-Specific Calibration: All statistics are derived from NQ futures data. Market behavior, volatility, and patterns differ across assets.
Hour-Specific Behavior: Different hours show dramatically different statistics. For example, the 9 AM EST hour (market open) shows much higher sweep probabilities (80%+) than the 5 PM EST hour (30-50%) due to differing liquidity and volatility conditions.
No Guarantee of Execution: While a 90% retracement probability is high, it means 10% of the time, price did NOT retrace. Always use proper risk management.
Technical Notes
The indicator uses hourly timeframe data via request.security() to determine previous hour values
Sweep detection occurs in real-time on the chart's timeframe
Statistics are hardcoded from the comprehensive backtested analysis (not calculated on-the-fly)
The indicator stores static values at the start of each hour to ensure consistency as the hour progresses
All percentage values are rounded to one decimal place for clarity
This indicator provides a statistically-grounded framework for understanding hourly price behavior in NQ futures. By combining real-time pattern detection with comprehensive historical analysis, it offers traders probabilistic insights to inform decision-making process within the specific context of each trading hour.

Session Highs and Lows🔑 Key Levels: Session Liquidity & Structure Mapper
The Key Levels indicator is an essential tool for traders as it automatically plots and projects critical Highs and Lows established during key trading sessions. These levels represent major liquidity pools and define the current market structure, serving as high-probability targets, support, or resistance for the remainder of the trading day.
⚙️ Core Functionality
The indicator operates in two distinct modes, tailored for different asset classes:
1. Asset Class Mode (Toggle)
You can switch between two predefined setups depending on the asset you are trading:
Stock Mode (RTH/ETH): Designed for US stocks and futures (e.g., NQ, ES, YM). It tracks and projects levels for Regular Trading Hours (RTH) (09:30-16:00) and Extended Hours (ETH) (16:00-09:30).
Forex/Default Mode (Asia/London/NY): Designed for global markets (e.g., currency pairs). It tracks and projects levels for the three major liquidity sessions: Asia (19:00-03:00), London (03:00-09:30), and New York (09:30-16:00).
🗺️ Key Levels Mapped
The script continuously tracks and plots the most significant structural levels:
Current Session High/Low: The running high and low of the currently active session.
Previous Session High/Low: The confirmed high and low from the most recently completed session. These are often targeted by market makers.
Previous Day High/Low (PDH/PDL): The high and low of the prior 24-hour day, acting as major structural boundaries and a crucial macro market filter.
🎛️ Advanced Liquidity Management
The indicator is built with specific controls for high-level liquidity analysis:
Extend Through Sweeps (Critical Setting):
OFF (Recommended): The projected line is automatically stopped or deleted the moment the price candle wicks or closes past it. This visually confirms that the liquidity at that level has been "swept" or "mitigated."
ON: The line extends indefinitely, treating the level as simple support/resistance, regardless of interaction.
Previous vs. Current View: You can select a checkbox (e.g., Use PREVIOUS London Level) to hide the current session's running levels and only display the static, confirmed high/low from the prior completed session. This helps declutter the chart and focus only on the confirmed structural levels.
Show Older History: Toggle to keep lines from prior days visible, allowing you to track multi-day structural context.
🎯 Trading Application
The lines plotted by the Key Levels indicator provide immediate, actionable information:
Bias Filter: Use the PDH/PDL to determine the overall market context. Trading above the PDH suggests a bullish bias, while trading below the PDL suggests a bearish bias.
Manipulation/Entry: Wait for price to aggressively sweep a Previous Session High/Low (line stops extending). This often signals a liquidity grab or "manipulation" phase. Look for entries in the opposite direction for the main move (Distribution).
Targets: Key levels (especially unmitigated ones) serve as excellent, objective take-profit targets for active trades.

Dskyz Options Flow Flux (OFF) - FuturesDskyz Options Flow Flux (OFF) - Futures
*This is a repost due to moderator intervention on use of ™ in my scripts. I'm in the process of getting this rectified. This was originally posted around mid-night CDT.
🧠 The Dskyz Options Flow Flux (OFF) - Futures indicator is a game changer for futures traders looking to tap into institutional activity with limited resources. Designed for TradingView this tool simulates options flow data (call/put volume and open interest) for futures contracts like MNQ MES NQ and ES giving u actionable insights through volume spike detection volatility adjustments and stunning visuals like aurora flux bands and round number levels. Whether u’re a beginner learning the ropes or a pro hunting for an edge this indicator delivers real time market sentiment and key price levels to boost ur trading game
Key Features
⚡ Simulated Options Flow: Breaks down call/put volume and open interest using market momentum and volatility
📈 Spike Detection: Spots big moves in volume and open interest with customizable thresholds
🧠 Volatility Filter: Adapts to market conditions using ATR for smarter spike detection
✨ Aurora Flux Bands: Glows with market sentiment showing u bullish or bearish vibes at a glance
🎯 Round Number Levels: Marks key psychological levels where big players might step in
📊 Interactive Dashboard: Real time metrics like sentiment score and volatility factor right on ur chart
🚨 Alerts: Get notified of bullish or bearish spikes so u never miss a move
How It Works
🧠 This indicator is built to make complex options flow analysis simple even with the constraints of Pine Script. Here’s the step by step:
Simulated Volume Data (Dynamic Split):
Pulls daily volume for ur chosen futures contract (MNQ1! MES1! NQ1! ES1!)
Splits it into call and put volume based on momentum (ta.mom) and volatility (ATR vs its 20 period average)
Estimates open interest (OI) for calls and puts (1.15x for calls 1.1x for puts)
Formula: callRatio = 0.5 + (momentum / close) * 10 + (volatility - 1) * 0.1 capped between 0.3 and 0.7
Why It Matters: Mimics how big players might split their trades giving u a peek into institutional sentiment
Spike Detection:
Compares current volume/OI to short term (lookbackShort) and long term (lookbackLong) averages
Flags spikes when volume/OI exceeds the average by ur set threshold (spikeThreshold for regular highConfidenceThreshold for strong)
Adjusts for volatility so u’re not fooled by choppy markets
Output: optionsSignal (2 for strong bullish -2 for strong bearish 1 for bullish -1 for bearish 0 for neutral)
Why It Matters: Pinpoints where big money might be stepping in
Volatility Filter:
Uses ATR (10 periods) and its 20 period average to calculate a volatility factor (volFactor = ATR / avgAtr)
Scales spike thresholds based on market conditions (volAdjustedThreshold = spikeThreshold * max(1 volFactor * volFilter))
Why It Matters: Keeps ur signals reliable whether the market is calm or wild
Sentiment Score:
Calculates a call/put ratio (callVolume / putVolume) and adjusts for volatility
Converts it to a 0 to 100 score (higher = bullish lower = bearish)
Formula: sentimentScore = min(max((volAdjustedSentiment - 1) * 50 0) 100)
Why It Matters: Gives u a quick read on market bias
Round Number Detection:
Finds the nearest round number (e.g. 100 for MNQ1! 50 for MES1!)
Checks for volume spikes (volume > 3 period SMA * spikeThreshold) and if price is close (within ATR * atrMultiplier)
Updates the top activity level every 15 minutes when significant activity is detected
Why It Matters: Highlights psychological levels where price often reacts
Visuals and Dashboard:
Combines aurora flux bands glow effects round number lines and a dashboard to make insights pop (see Visual Elements below)
Plots triangles for call/put spikes (green/red for strong lime/orange for regular)
Sets up alerts for key market moves
Why It Matters: Makes complex data easy to read at a glance
Inputs and Customization
⚙️ Beginners can tweak these settings to match their trading style while pros can dig deeper for precision:
Futures Symbol (symbol): Pick ur contract (MNQ1! MES1! NQ1! ES1!). Default: MNQ1!
Short Lookback (lookbackShort): Days for short term averages. Smaller = more sensitive. Range: 1+. Default: 5
Long Lookback (lookbackLong): Days for long term averages. Range: 5+. Default: 10
Spike Threshold (spikeThreshold): How big a spike needs to be (e.g. 1.1 = 10% above average). Range: 1.0+. Default: 1.1
High Confidence Threshold (highConfidenceThreshold): For strong spikes (e.g. 3.0 = 3x average). Range: 2.0+. Default: 3.0
Volatility Filter (volFilter): Adjusts for market volatility (e.g. 1.2 = 20% stricter in volatile markets). Range: 1.0+. Default: 1.2
Aurora Flux Transparency (glowOpacity): Controls band transparency (0 = solid 100 = invisible). Range: 0 to 100. Default: 65
Show Show OFF Dashboard (showDashboard): Toggles the dashboard with key metrics. Default: true
Show Nearest Round Number (showRoundNumbers): Displays round number levels. Default: true
ATR Multiplier for Proximity (atrMultiplier): How close price needs to be to a round number (e.g. 1.5 = within 1.5x ATR). Range: 0.5+. Default: 1.5
Functions and Logic
🧠 Here’s the techy stuff pros will love:
Simulated Volume Data : Splits daily volume into call/put volume and OI using momentum and volatility
Volatility Filter: Scales thresholds with volFactor = atr / avgAtr for adaptive detection
Spike Detection: Flags spikes and assigns optionsSignal (2, -2, 1, -1, 0) for sentiment
Sentiment Score: Converts call/put ratio into a 0-100 score for quick bias reads
Round Number Detection: Identifies key levels and significant activity for trading zones
Dashboard Display: Updates real time metrics like sentiment score and volatility factor
Visual Elements
✨ These visuals make data come alive:
Gradient Background: Green (bullish) red (bearish) or yellow (neutral/choppy) at 95% transparency to show trend
Aurora Flux Bands: Stepped bands (linewidth 3) around a 14 period EMA ± ATR * 1.8. Colors shift with sentiment (green red lime orange gray) with glow effects at 85% transparency
Round Number Visualization: Stepped lines (linewidth 2) at key levels (solid if active dashed if not) with labels (black background white text size.normal)
Visual Signals: Triangles above/below bars for spikes (size.small for strong size.tiny for regular)
Dashboard: Bottom left table (2 columns 10 rows) with a black background (29% transparency) gray border and metrics:
⚡ Round Number Activity: “Detected” or “None”
📈 Trend: “Bullish” “Bearish” or “Neutral” (colored green/red/gray)
🧠 ATR: Current 10 period ATR
📊 ATR Avg: 20 period SMA of ATR
📉 Volume Spike: “YES” (green) or “NO” (red)
📋 Call/Put Ratio: Current ratio
✨ Flux Signal: “Strong Bullish” “Strong Bearish” “Bullish” “Bearish” or “Neutral” (colored green/red/gray)
⚙️ Volatility Factor: Current volFactor
📈 Sentiment Score: 0-100 score
Usage and Strategy Recommendations
🎯 For Beginners: Use high confidence spikes (green/red triangles) for easy entries. Check the dashboard for a quick market read (sentiment score above 60 = bullish below 40 = bearish). Watch round number levels for support/resistance
💡 For Pros: Combine flux signals with round number activity for high probability setups. Adjust lookbackShort/lookbackLong for trending vs choppy markets. Use volFactor for position sizing (higher = smaller positions)

Market Structure V3Indicator Description:
The Market Structure indicator is a unique and innovative tool for identifying and visualizing key market structures based on dynamic swing highs and lows. This indicator stands apart from similar tools by utilizing a distinct methodology for updating levels and identifying trends, ensuring precision and flexibility in market analysis.
Key Features of Uniqueness:
1. No Fixed Lookback Periods for Extremum Detection:
- Unlike most indicators that rely on a predefined number of candles (lookback period) to determine highs or lows, this script dynamically updates levels based solely on price action.
- A new high (resistance) or low (support) is confirmed only when the closing price breaks above the previous high or below the previous low, representing the last significant extremums .
- This approach eliminates arbitrary lookback-based restrictions, allowing the indicator to adapt seamlessly to different market conditions and timeframes.
2. Dynamic Level Adjustments:
- Levels are recalculated and adjusted in real time as new price action unfolds, providing traders with highly accurate and relevant support and resistance levels.
- The upper and lower bounds serve as dynamic anchors for trend analysis, updating only when a confirmed breakout occurs.
3. Fractal and Trend-Driven Logic:
- The script inherently respects the fractal nature of price movements by focusing on confirmed breakouts of previous significant extremums , avoiding reliance on shorter-term noise.
- This makes the indicator particularly effective for identifying true trend reversals and continuations.
4. Visual Clarity and Structure Mapping:
- The indicator labels the following structural points directly on the chart:
- **Higher Highs (HH)** for uptrend confirmation.
- **Lower Highs (LH)** for potential trend weakening.
- **Lower Lows (LL)** for downtrend confirmation.
- **Higher Lows (HL)** for potential trend reversals.
- Levels and labels are updated dynamically and accurately reflect the market's structural evolution.
5. Clean and Noise-Free Analysis:
- The absence of arbitrary inputs (e.g., lookback periods) ensures the indicator focuses only on meaningful price action, reducing false signals.
- Works seamlessly across all instruments and timeframes without requiring constant parameter adjustments.
6. Highly Adaptable:
- Suitable for any financial market, including stocks, forex, and cryptocurrencies.
- Performs equally well on all timeframes, from intraday to long-term analysis.
How the Indicator Works:
1. Dynamic Level Updates :
- The indicator evaluates price action in real time and identifies significant levels based on breakouts above previous highs or below previous lows.
- Upper Bound (Resistance) : Updated only when the closing price exceeds the previous significant high.
- Lower Bound (Support) : Updated only when the closing price falls below the previous significant low.
2. Trend Determination:
- Identifies and marks structural points (HH, LH, LL, HL) as trends develop.
- Swing points are updated dynamically without relying on fixed lookback parameters, ensuring that levels reflect the true market structure.
3. Confirmation Logic:
- The script uses a user-configurable parameter `Extremum confirmation bars count` to refine the process of confirming significant swing points.
- This ensures flexibility in adapting to different market conditions while maintaining precision in level detection.
Unique Advantages Over Similar Indicators:
1. No Arbitrary Inputs:
- Unlike other indicators that require users to set the number of candles for extremum detection, this script eliminates the need for such settings, relying solely on actual price breakouts.
2. Dynamic Real-Time Adjustments:
- The logic of level updates is event-driven (based on closing prices crossing key levels), making it more reactive and precise compared to static lookback-based calculations.
3. Enhanced Structural Clarity:
- Focuses exclusively on confirmed significant levels , avoiding clutter and ambiguity often seen in lookback-based indicators.
4. Fractal and Self-Adaptive Nature:
- The script inherently respects market fractality, making it effective across all timeframes and market conditions.
Practical Applications:
- Trend Identification:
Helps identify whether the market is in an uptrend, downtrend, or consolidation phase.
- Entry and Exit Points:
Use swing highs and lows as references for entering or exiting positions.
- Support and Resistance Levels:
Dynamic levels provide actionable areas for placing stop-losses and take-profits.
Input Parameters:
- Extremum Confirmation Bars Count:
Adjusts the sensitivity of extremum detection. The higher the value, the more conservative the indicator becomes in confirming levels. Default is `3`.
Chart Setup and Usage Notes:
1. Clean Visualization:
- Ensure a clean chart for better visibility of structural points and levels.
- Do not overlay with additional indicators unless explicitly required.
2. User Guidance:
- Combine this indicator with volume analysis or other confirmation tools to enhance decision-making.
Disclaimer:
This indicator is for educational purposes only and does not constitute financial advice. Always perform your own analysis and trade responsibly.

Auto-Support v 0.3The "Auto-Support v 0.3" indicator is designed to automatically detect and plot multiple levels of support and resistance on a chart. It aims to help traders identify key price levels where the market tends to reverse or consolidate. Here’s a breakdown of its functionality and goals:
Objective:
The primary objective of the Auto-Support v 0.3 indicator is to provide traders with a clear, visual representation of support and resistance levels. These levels are determined based on a predefined sensitivity parameter, which adjusts how tightly or loosely the indicator reacts to recent price movements. The indicator can be applied to any chart to assist in identifying potential entry and exit points for trades, enhancing technical analysis by displaying these important price zones.
Description:
Support and Resistance Calculation:
The indicator calculates multiple levels of support and resistance using the highest and lowest prices over a defined period. The "sensitivity" parameter, which ranges from 1 to 10, determines how sensitive the calculation is to recent price changes. A higher value increases the number of bars used to calculate these levels, making the levels more stable but less responsive to short-term price movements.
Visual Representation:
The support levels are drawn in green with a customizable transparency setting, while resistance levels are displayed in red with similar transparency controls. This visual representation helps traders identify these levels on the chart and see the strength or weakness of the support/resistance zones depending on the transparency setting.
Multiple Levels:
The indicator plots 10 distinct levels of support and resistance (from 1 to 10), which can offer a more granular view of price action. Traders can use these levels to assess potential breakout or breakdown points.
Customization:
Sensitivity: The sensitivity input allows traders to adjust how aggressively the indicator reacts to recent price data. This ensures flexibility, enabling the indicator to be tailored to different trading styles and market conditions.
Transparency: The transparency input adjusts the visual opacity of the support and resistance lines, making it easier to overlay the indicator without obscuring other chart elements.
Key Goals:
Dynamic Support/Resistance Identification: Automatically detect and display relevant support and resistance levels based on price history, removing the need for manual chart analysis.
Customizable Sensitivity: Offer a flexible method to adjust how the indicator identifies key levels, allowing it to fit different market conditions.
Clear Visualization: Provide easy-to-read support and resistance levels with customizable colors and transparencies, enhancing visual clarity and decision-making.
Multiple Levels: Display up to 10 levels of support and resistance, allowing traders to consider both short-term and longer-term price action when making trading decisions.
By using this indicator, traders can more effectively identify key price zones where price may reverse, consolidate, or break out, providing a solid foundation for developing trading strategies.

Day High/Low and Horizontal Lines with Custom Increments How It Works:
Day High and Day Low: The indicator tracks and displays the highest and lowest prices of the current trading day. These values are updated dynamically throughout the day.
Custom Horizontal Lines: The user specifies a starting price and an increment value. The indicator then plots multiple horizontal lines above and below the starting price, spaced at the given increment. Up to 15 lines can be drawn in both directions (above and below).
Alerts: Alerts are triggered when the price crosses any of the horizontal lines, helping traders monitor potential breakouts or reversals.
Use Case:
This indicator is useful for traders who want to:
Track the Day High/Low: Easily reference the high and low of the current day as key price levels.
Monitor Key Price Levels: Draw and observe custom horizontal levels above and below a specific price, such as support/resistance levels or price targets.
Set Alerts: Receive notifications when the price crosses these key levels, helping identify potential breakout or breakdown points in the market.
Why Use This Indicator:
Day Trading: Traders can monitor the high and low of the current trading day to see if the price breaks through key levels.
Breakout Strategy: The custom horizontal lines provide reference points for potential breakout levels, with alerts helping traders act in real-time.
Support and Resistance: The plotted lines can represent predefined support or resistance levels, allowing traders to plan their entries and exits effectively.
The indicator gives a structured way to visualize price movements, highlight important price levels, and react quickly with alerts when the price crosses those levels.